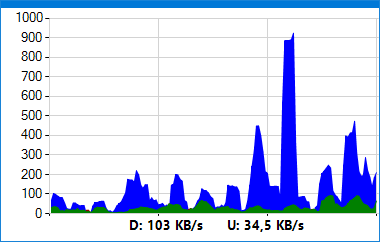
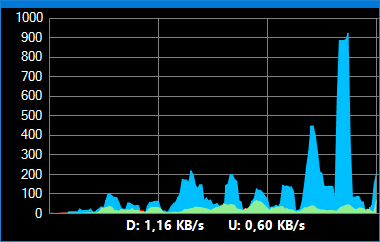
NetGraph is a free to use network bandwidth monitor. It shows real-time information about the state of network traffic in a visual display format selected by the user. NetGraph can monitor the data flows of wired, Wi-Fi and mobile broadband connections, as well as that of the local network and the internet.
The programs unique functions include several types of display modes and the active tray icon. By selecting and setting these appropriately, the user can always access the most network information without interfering with the display of other programs.
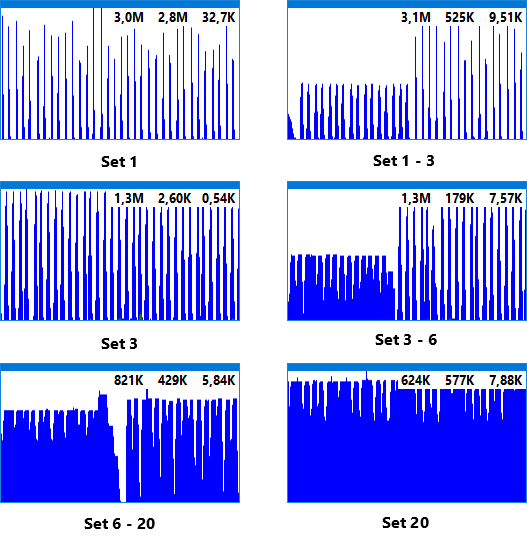
In case of graphical representations, the sampling frequency can be chosen, and the limit value of the displayed graph or progress indicator can be set too. A unique function is the option to set an input averaging level, which significantly enhances the program’s user experience and enables efficient displays.
Properties of NetGraph:
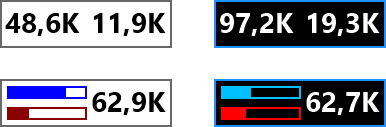
- Several display modes: graph, progress indicator and numeric values, as well as the combination of these in several sizes
- When using more than one network card, the data source can be selected
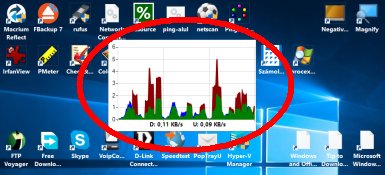
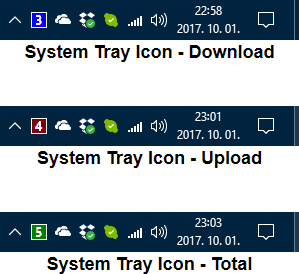
- The active tray icon shows information about the most important data in a simple way, even if the program window is hidden
- Supports wired, Wi-Fi and mobile broadband connections
- The display format and the transparency can be selected
- Click-through: it makes the area covered by the NetGraph window visible and clickable by mouse in a fast and simple way
- Shows basic information about the network and offers an easy method to ping multiple IP addresses
- Doesn’t require installation, free to use, it supports Windows 7/8/10/11 operating systems