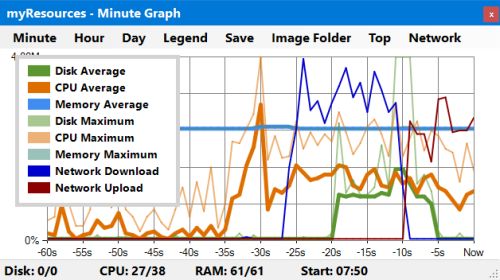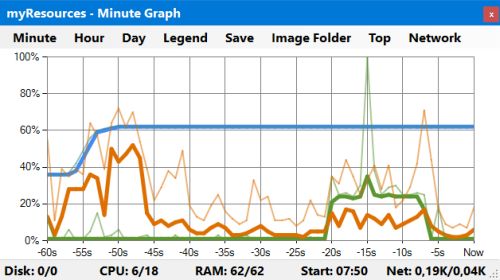
SumGraph can be started from the context menu, or using the “All in One” icon. It displays the load status of the disc, CPU, and memory in a single graph for the last minute, hour, or day. A thick line displays the current average value, while a thin line displays the maximum value.
The 1 minute resolution chart also has the option of displaying network traffic. This operation can be initiated from the Network menu. The maximum value of the network graph is equal to the maximum display interval value and is automatically scaled.
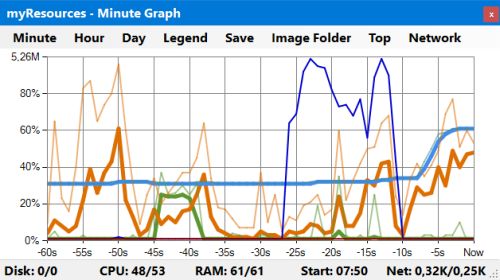
In the lower part of SumGraph, the average and maximum values of the resources with 1 second resolution, the start time of the program and the data transfer rate of the network are displayed in numeric form.
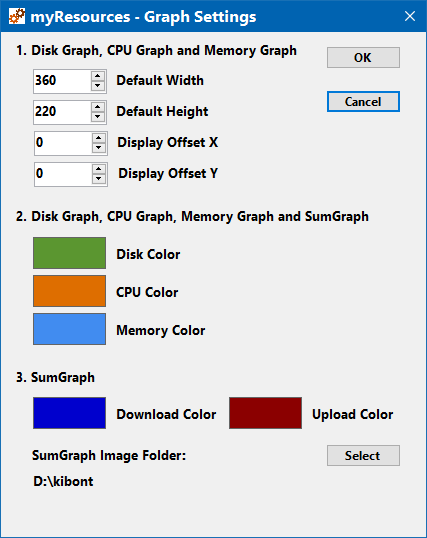
It is possible to save the current state of the graph from the Save menu as an image. A successful backup is indicated by a short acoustical signal (beep). SumGraph's appearance and operation settings are available on the Graph → Settings path.